This article is excerpted from Professor Pollack’s book “A World Without Ice” (Avery Books, October 2009).
In 1958, Charles David Keeling of the Scripps Institute of Oceanography in California began making measurements of the CO2 in the atmosphere atop Mauna Loa in Hawaii. These daily measurements have continued to the present-day, and provide the world’s longest instrumental record of the direct consequence of burning carbon-based fossil fuels.
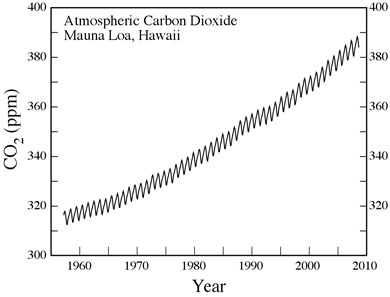
The ‘Keeling Graph’ shows atmospheric concentrations over the past 50 years. Even when Charles Keeling began recording the data in 1958, carbon dioxide levels had risen above their usual range, and they’ve been rising ever since. The smaller fluctuations indicate seasonal variations in CO2 uptake by vegetation in the northern hemisphere.
These measurements show an increase in CO2 concentrations in the atmosphere from 315 parts per million (ppm) in 1958 to 390 ppm in 2009, an increase of 22% in just the past half-century.
Riding along on this upward trend of CO2 in the atmosphere is a fascinating annual oscillation—a small seasonal up-and-down that is the signature of photosynthesis occurring in the plant life of Earth each year. Most of the land area on Earth, and therefore most of the land plants, are in the northern hemisphere. During each northern hemisphere summer the growth of plant life draws CO2 out of the atmosphere; in winter when much of the vegetation is dormant, the CO2 resumes its upward climb. This oscillation represents the actual metabolism of plant life on our planet, the annual “breathing” of Earth’s green vegetation.
During the 1990s, CO2 continued its climb above pre-industrial levels at a rate of 2.7% per year, a rate more than twice as great as when Keeling began making measurements in 1958. In the first decade of the 21st century the rate has increased to 3.5%. Now more than a half-century long, the Keeling graph is the iconic signature of human energy consumption, acknowledged even by skeptics.
We can place the Keeling measurements into a much longer temporal context provided by microscopic bubbles of air trapped in ice. The deep ice core drilled at the Russian Vostok Station in East Antarctica, which at its bottom comprises ice as old as 450,000 years, gives us a remarkable historical record of atmospheric carbon dioxide and methane.

Ice cores from the Vostock station in Antarctica show that atmospheric CO2 levels (bottom line) are closely related to global temperatures (top line). In addition, CO2 concentrations are now far higher than they have been in at least 800,000 years.
The mechanism of record keeping in the ice is fascinating—when snowflakes fall they accumulate into a very fluffy layer of flakes and air, which gets compressed into ice by the weight of subsequent snowfalls accumulating above. The air that is present becomes trapped as microscopic bubbles in the ice layer, and those bubbles constitute samples of the atmosphere at the time the snow recrystallized into an ice layer. The gases contained in the bubbles can be extracted and chemically analyzed to reveal the year-by-year greenhouse gas concentrations in the atmosphere over the complete time span represented in the ice core.
These remarkable graphs show not only that the temperature went up and down with a 100,000-year periodicity, but that CO2 did as well, in a pattern that is almost a direct overlay of the temperature record. The fundamental lesson of this overlay is that temperature and CO2 are closely related in the processes that produce ice ages. A second observation drawn from these graphs is that atmospheric CO2, over the course of the four complete ice age cycles shown, ranged roughly between 200 and 300 ppm, from the cold of a glacial maximum when ice sheets covered vast expanses of the northern continents, to the briefer warm times that separated glaciations. Ice cores from elsewhere in Antarctica have extended the history of temperature and CO2 back some 800,000 years, but throughout this long record CO2 did not move out of the 200-300 ppm range.
But no longer. At the beginning of the Industrial Revolution, in the middle of the 18th century, ice bubbles showed a concentration of CO2 at around 280 ppm, near the upper bound of 300 ppm that characterized the earlier interglacial periods. By 1958 when Dave Keeling began his measurements of atmospheric CO2 atop Mauna Loa in Hawaii, CO2 had already reached 315 ppm, well beyond the upper bound of the past 800,000 years. The concentration in 2009, a half-century after Keeling began these measurements, reached 390 ppm, and is increasing by two to three ppm each year. It will likely cross the 400 ppm threshold in just a few more years. In the absence of any effective mitigation of greenhouse gas emissions in the near future, CO2 in the atmosphere will reach the 450 ppm mark by 2030, a level that most climate scientists think will be accompanied by increasingly dangerous changes in our climate.
In retrospect, a landmark point was reached in the mid-20th century when the concentration of CO2 and other greenhouse gases moved out of the range of natural variability displayed over the previous 800,000 years. And it has become clear that yet another tipping point had been crossed, a point in time when the human influence on climate has overtaken the natural factors that had previously governed climate. Since then, population growth and increasing technological prowess have made the human influence increasingly dominant. Today the atmospheric concentrations of carbon dioxide and methane are substantially above their respective pre-industrial levels, due to the contributions by humans and our many machines. This change in atmospheric chemistry is the real signature of human industrial activity, and the most important driver of contemporary global warming.
By any measure, humans have moved to center stage. We have placed our footprints indelibly upon Earth, and by changing the chemistry of Earth’s atmosphere we have inadvertently begun a planet-wide experiment with the global climate. Today ice is already retreating because of human activities on Earth, and is perhaps on a trajectory to disappearance. Will future generations live on a world without ice?
