I’ve seen fire, and I’ve seen rain
Those who work with me say they consider me steady and measured. But when I saw the heat forecasts for Seattle and Portland in late June, I was shocked. The temperature records were not just high. They were 10 degrees higher than standing records. In fact, the forecasted temperatures were so high that some seasoned scientists dismissed them as fundamentally flawed. But the forecasts verified; they proved to be correct.
The severity of this heat event is hard to exaggerate. We have had several heat events since late June, and it’s almost as if the hot weather isn’t newsworthy unless the mercury climbs to 120 degrees. We normalize, and that’s dangerous.
While heat is the story in many places in the northern hemisphere, chronic flooding has dominated the narrative in Southeast Michigan. Floods in summer 2021 are following a drought from the previous winter and spring, which reached severe status by mid-June. That drought came on the heels of several years of record precipitation, contributing to very high lake levels and persistent coastal flooding.

Click on the image to enlarge.
The graph here (from Frank Marsik) shows the accumulated precipitation recorded at U-M’s station at the Matthaei Botanical Gardens. The blue line represents the average accumulation for the previous 30 years. The orange line represents accumulation so far this year. Precipitation levels were well below average until late June. Then, largely in one event, we caught up with the average. As July unfolds, precipitation in Michigan is now well above the average.
These bursts of rain are coming in giant, intense steps. And this trend is not just happening in the U.S. We’ve seen extraordinary floods in Germany and China too.
This is global warming
I recently participated in a webinar that analyzed the quality of the National Weather Service’s heatwave forecast. Experts stated that the observed temperature was five-to-six standard deviations above an average derived from observations recorded between 1979-2010. Let’s place that in perspective: When you have an idealized bell-shaped distribution, if a value is three standard deviations from normal, it is outside of the range of 99.7 percent of the observations. If a value is six standard deviations above normal, then there are about two chances in a billion it will occur.
Look at the heat events surrounding the Earth, the floods encircling the Earth, and the physical processes that explain and connect these events. There is no rational chance that they are random. The same can be said for the rainfall increases in the Great Lakes.
Welcome to a land of regional fire and rain. All these events and their convergence with the fundamental physics-based behavior of heat, air, and water compels us to conclude global warming influences all weather every day.
Only the beginning
In my previous column, I wrote that living conditions in 2100 would depend on our behavior today. I stated, “ … we must develop a more systematic and anticipatory approach to extreme storms, fires, droughts, and floods. Today’s decisions regarding adaptation and mitigation will influence the quality of life for decades to come.”
It seems so obvious. People are dying in heat and floods occurring in unfamiliar places with unprecedented severity. Roads are buckling and washing away. I have heard from people on the shores of North Carolina and the shores of Lake Ontario that they cannot find contractors and engineers to do the work that would offset current and future damage.
Here in Southeast Michigan, chronic flooding of houses has persisted for about five years. Along the eroding shores of the Great Lakes, houses are disappearing and septic systems are overwhelmed. People are reacting by using pumps and more concrete. Some builders are using stilts. And in many ways, Michigan is a climate change “winner.”
Flames and floods
The heat and drought in the American West set the stage for massive forest fires that now affect air quality as far as the East Coast. (My sister in North Carolina calls to ask about when to go out during the day to avoid the worst of air pollution. I tell her she can re-purpose those COVID-19 PM 2.5 masks.)
These days, the majority of the National Forest Service budget is dedicated to firefighting. States most affected are adding billions to the coffers.
Is this where we are heading? A society that pumps excessive water in one place and fights devastating wildfires in others?
Though it is essential to reduce carbon dioxide emissions now, we must remember we are only approaching the onset of decades of continued warming. Those decades will deliver more drought, fire, rain, and flood. Where and when it is wet, it will be very wet. Where and when it is dry, it will be very dry.
The purpose of adaptation policy is to proactively develop practices and behaviors that will protect our lives and livelihoods. We need new building codes, land-use policy, and engineering standards. We need scenarios that identify when a population must abandon a location and scenarios to support the “climate refugees” forced to relocate.
We do not want an economy built on haphazard, one-off responses to disruptive emergencies. But if we continue down this reactive path, our descendants will be left wondering what was wrong with us stupid, stupid humans.
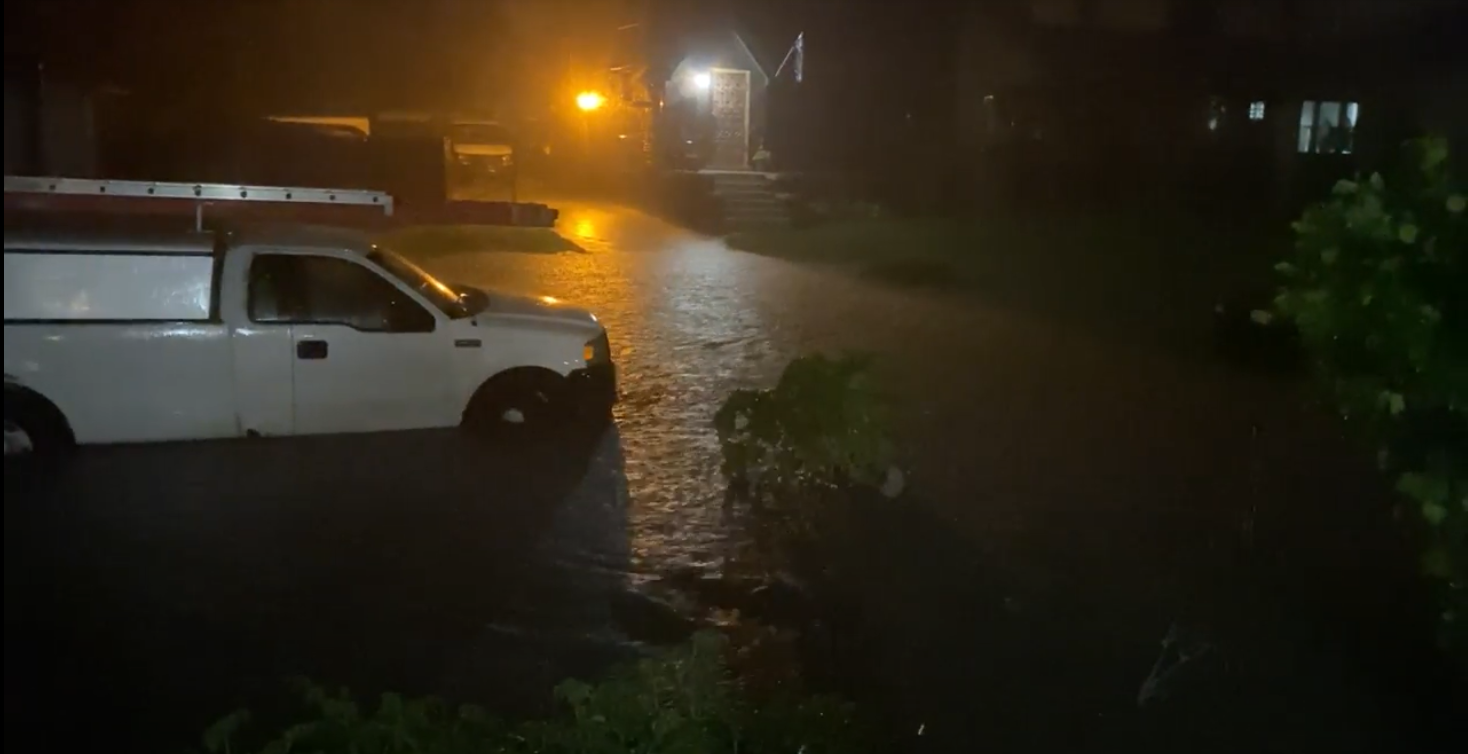
(Lead image: Flooding in Detroit is increasingly chronic.)

Russell Lyons - 1983
I agree with all you say, except for this use of statistics: You write as if the “idealized bell-shaped distribution” (i.e., Gaussian) should apply to rainfall amounts. I don’t know the data, but I would be surprised if the data match so closely a Gaussian. With many datasets, extreme values are much more common than in a Gaussian distribution. Can you clarify?
Reply
Richard Rood
You are correct the statistics of precipitation are complex.
Here is a open source paper for those who want to dig deeper.
https://journals.ametsoc.org/view/journals/atsc/76/11/jas-d-18-0343.1.xml
The paragraph I wrote was about temperature, and though temperature is far closer to Gaussian, even that is arguable, especially as the statistics are changing right now. And the relation of temperature change to precipitation is highly nonlinear so the precipitation distribution will be changing in a different way.
The GISS website has some nice graphs and tools for looking at temperature statistics and the station level, but I can’t hyperlink the ones showing the Gaussian shape and their shift quickly.
The statement I made about precipitation is based, ultimately, if you look at the number of, say, 500 year events, their return, their near ubiquitous presence spatially, or say having 3 all time greatest precipitation years in less than a decade, it is unlikely that they are random. I would not maintain at the 6 sigma level, but perhaps at 3 or 4 sigma.
Thanks for reading and commenting.
r
Reply
Richard Rood
To demonstrate the approximately Gaussian (bell-shaped) distribution of temperature, follow this link to a figure from Jim Hansen and Makiko Sato:
https://mcusercontent.com/0ebaeb14fdbf5dc65289113c1/images/49ae5247-6601-45ab-a258-72fcf426e836.png
In the figure is shown “Shifting distribution of temperature anomalies for Northern Hemisphere land for June-July-August. The graph shows the frequency of occurrence (y-axis) of local temperature anomalies divided by the local standard deviation (x-axis) obtained by binning all local results for the indicated region and period into 0.05 frequency intervals. Area under each curve is unity. Standard deviations are for the 1951-1980 period.”
Jim’s monthly update on temperature is here: https://mailchi.mp/caa/may-2021-global-temperature-update-6vdouglinl?e=641113be12
Reply
Russell Lyons - 1983
I had not noticed the switch you made from rainfall to temperature. Thanks for clarifying that and for the additional sources you gave. It is remarkable how close temperature anomalies are to Gaussian, but the tails are, of course, too thin to see on the figure. Do you have a source that explains why it is so close to Gaussian?
In any case, your comment reply says, “The statement I made about precipitation is based, ultimately, if you look at the number of, say, 500 year events, their return, their near ubiquitous presence spatially, or say having 3 all time greatest precipitation years in less than a decade, it is unlikely that they are random. I would not maintain at the 6 sigma level, but perhaps at 3 or 4 sigma.” What do you mean here by “sigma”? Since rainfall does not at all follow a Gaussian distribution, the relationship between probabilities and standard deviations from the mean is not fixed. My interpretation of your statement is that you refer to what the probabilities would be if the distribution were Gaussian, but that seems unnecessarily indirect.
Reply
Richard Rood
Hi again, I must admit that statistics is one of my many weak spots.
As for the figure I linked above, yes they are small, but it is interesting to me that if you look at the 1951-1980 it is much more symmetrical, than in later years. If you examine the observations, then the temperature starts to take off in the 1970s. You can see the high-end of the graph, even in these small graphs, thickening.
As to why Gaussian? First, I am not sure exactly your reasoning that temperature would not be ~ Gaussian. When I think about temperature it is a field whose variability is strongly influenced by fluid dynamics. It is, compared to precipitation, quite smooth. And in the, say, more stationary time in a statistically steady state system temperature is largely limited, high and low, by physics. So, with adequate sampling, it is reasonable to expect, first, a Gaussian distribution. In some cases, you can argue for a wave transport dominated regime a Gaussian distribution.
However, I think we often start based on 1) a bunch of observations, and 2) that we can use the Gaussian distribution as a useful theoretical starting point.
However, those who study statistics will state that there are few true Gaussian distributions in climate. Here is another open source paper.
https://journals.ametsoc.org/view/journals/clim/26/3/jcli-d-11-00504.1.xml
An interesting aspect of this analysis is that many of the non-Gaussian aspects of temperature are related to features that have a physical influence, for example, topography. In as much as one takes a global perspective in a time of stationarity one can argue (assume) that those non-Gaussian features average out.
I think that once you have stationary statistics, whether Gaussian or not, when you observe the distribution to start to change, for instance “500-year” events occurring at far higher frequency, you are led to the conclusion that you are not observing random events. When this aligns with theory and other sources of information, your confidence is increased that there is change for a particular reason.
If the distribution is non-Gaussian, then it requires more parameters than mean and standard deviation (sigma) to define it. However, mean and standard deviation are still part of the description. That, indeed, complicates the argument, which is why multiple lines of evidence and reasoning are needed in comprehensive attribution studies. For example from Ben Santer
https://thehill.com/opinion/energy-environment/564722-how-do-climate-scientists-study-the-causes-of-climate-change
Reply