Beware of ‘advanced glycation end’ products (AGEs)
Most chronic diseases incubate over years, not overtly expressing until reaching a critical horizon, often in mid-to-late adulthood. Only after years of incubating do the invading forces unleash their devastation. Whether it’s diabetes, heart disease, Alzheimer’s, sarcopenia, arthritis, or any of the other chronic diseases, we are shocked when we “suddenly” become afflicted. With surprise and fear we cry, “How did this happen to me?”
Guess what? Precursors for most chronic diseases have been there for years, just waiting to erupt.
Inflammation
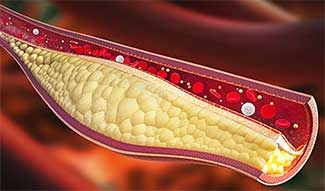
Inflamed arteries are common in heart disease. When fats build up in coronary artery walls, the body produces inflammatory chemicals which can, over time, trigger a blood clot that can cause a heart attack or stroke.
We now understand that various inflammatory processes – part of the complex biological response of body tissues to harmful stimuli, such as pathogens, damaged cells, irritants, and toxins – commonly represent the “silent” markers of chronic disease.
The word “inflammation” traces back to the Latin for “set afire.” In some conditions, like rheumatoid arthritis, there are expressions of heat, pain, redness, and swelling. In other cases, like early-onset aging, heart disease, Alzheimer’s, and type 2 diabetes, inflammatory signs are not so obvious. Without sophisticated medical tests, it’s difficult or impossible to know the full extent of inflammatory processes that eventually lead to expressions of a chronic disease.
As these long-term inflammatory processes incubate in the body, waiting to be vented, they may begin to reveal themselves as diabetic-induced shock, signs of early onset Alzheimer’s, or symptoms of inflammatory bowel disease (ulcerative colitis and/or Crohn’s disease). Or, they could manifest as joint pain.
Toxins as inflammatory agents
Toxicity represents the degree to which a substance, usually a chemical or a mixture of substances, can damage an organism (animal, bacterium, or plant), or a substructure of an organism, such as a cell (cytotoxicity) or an organ like the liver (hepatotoxicity).
Effects of a toxin are dose-dependent. Thus, even water can lead to water intoxication (hyponatremia) when taken in too high a dose. Toxicity is species-specific, making cross-species analyses problematic.
There are four types of recognized toxins: chemical, biological, physical, and radiation.
- Chemical toxins include nonliving substances such as lead, mercury, and chlorine gas, and such living compounds as methyl alcohol (Methanol — CH₃OH), most medications, and poisons from living species (like snakes).
- Biological toxins include disease-causing microorganisms and parasites (termed pathogens) that are difficult to measure because their “threshold dose” differs wildly among individuals.
- Physical toxins include physical substances that interfere with biological processes. These include substances like coal dust, asbestos fibers, or silicon dioxide. Asphyxiant gases, like smog, also are considered physical toxicants.
- Radiation toxins include some weakly radioactive substances, such as uranium. These are classified as chemical toxicants.
Advanced glycation end products (AGEs) are inflammatory toxins
Advanced glycation end products, or AGEs, represent an assorted group of large molecules formed by the process of glycation, which involves bonding of a sugar molecule, such as glucose or fructose, to a protein or fat molecule without help from enzymes. The resulting macromolecules (AGEs) are considered biologic toxins that associate with such issues as diabetes, aging, chronic kidney disease (CKD), anemia, poor skeletal muscle strength and performance, cardiovascular disease, and brain and bone disorders, just to name a few. The figure below shows the many AGEs-induced chronic-disease conditions that reduce longevity.

Humans are exposed to two main sources of AGEs: endogenous AGEs formed within the body, and exogenous AGEs ingested from foods.
Endogenous AGEs
There is not much we can do about endogenous AGEs that generate mainly in the bloodstream from small proportions of the absorbed dietary simple sugars glucose, fructose, and galactose. Since fructose has about 10 times the glycation activity of glucose, it is believed to contribute more than glucose to endogenous AGEs’ inflammatory processes. Some endogenous AGEs are benign, but others are more reactive than the sugars from which they are derived, and thus are implicated in many age-related chronic diseases. For example, elevated endogenous AGEs have been implicated in cardiovascular diseases (where endothelium, fibrinogen, and collagen are damaged); Alzheimer’s disease (where amyloid proteins are side-products of reactions progressing to AGEs); cancer (where acrylamide and other AGE side-products release); peripheral neuropathy (where myelin – a fatty white substance that surrounds the axon of some nerve cells is attacked); and other sensory losses such as deafness (due to demyelination).
Exogenous AGEs
 A diet consisting of high levels of animal meats, sugar, and fat represents the major source of exogenous AGEs. Some AGEs are formed when food cooks at elevated temperatures, i.e., during deep-frying, broiling, roasting, or grilling. AGEs also form during high-temperature processing of certain foods such as pasteurized dairy products, cheeses, sausages, and processed meats, as well as commercial breakfast cereals. Glycation processes also may contribute to formation of acrylamide, a potential carcinogen formed during deep-fried cooking of certain foods, particularly potatoes (think french fries).
Until recently, it was thought that exogenous glycation-derived AGEs were negligible contributors to inflammation and disease development. This conclusion was almost entirely based on animal research. Recent research on humans, however, has shown this not to be the case.
Moreover, food manufacturers have added AGEs to foods in the form of flavor enhancers and colorants to improve appearance. Foods with significant browning, caramelization, or directly added preformed AGEs can be high in these compounds. Foods with very high exogenous AGEs include donuts, barbecued meats, cake, and dark-colored soda pop.
Reducing AGEs promotes healthy aging and longevity
The number of scientific publications on AGEs has increased astronomically in the past decade. There is now convincing human evidence from in vitro studies, animal models, clinical and pathological studies, epidemiological human cohort studies of aging, and human clinical trials that limiting AGEs promotes reduction in inflammation and oxidative stress, and thus improves health and longevity.The table below is sourced from an article in the Journal of the American Dietetic Assn. It presents examples of the AGE enzyme activity for different foods. AGE enzyme activity expresses as kilounits (kU) per 100 grams of a food (column 1) or as AGE enzyme activity in kU units per food serving (column 2). The serving size expresses as grams (g) for solids; millileters (mL) for liquids. (A more comprehensive list can be found at the Journal of the American Dietetic Assn.) Not surprisingly, on a comparative basis, animal-based foods contain the most exogenous AGE activity.
| FATS | AGEs per 100g | Serving Size (g) | AGEs per serving |
| Almonds, roasted | 6,650 | 30 | 1,995 |
| Avocado | 1,577 | 30 | 473 |
| Butter, sweet cream, unsalted (Land O’ Lakes) | 23,340 | 5 | 1,167 |
| Margarine (tub) | 17,520 | 5 | 876 |
| Mayonnaise | 9,400 | 5 | 470 |
| Oil, sesame | 21,680 | 5 | 1,084 |
| BEEF | AGEs per 100g | Serving Size | AGEs per serving |
| Frankfurter, broiled 450 degrees, 5 min | 11,270 | 90 | 10,143 |
| Hamburger (McDonald’s) | 5,418 | 90 | 4,876 |
| Steak, broiled | 7,479 | 90 | 6,731 |
| Steak, (pan-fried w/olive oil) | 10,058 | 90 | 9,052 |
| CHICKEN | AGEs per 100g | Serving Size | AGEs per serving |
| Breast with skin, 450 degrees, 45 min. | 8,244 | 90 | 7,420 |
| Back/thigh w/skin, roasted, BBQ | 18,520 | 90 | 16,668 |
| Leg w/skin, roasted | 10,997 | 90 | 9,897 |
| Thigh, w/skin, roasted | 11,149 | 90 | 10,034 |
| TURKEY | AGEs per 100g | Serving Size | AGEs per serving |
| Burger, pan-fried with cooking spray | 7,968 | 90 | 7,171 |
| Burger, pan-fried with 5ml Canola oil | 8,251 | 90 | 7,426 |
| PORK | AGEs per 100g | Serving Size | AGEs per serving |
| Bacon, fried, 5 mins, no added oil | 91,577 | 13 | 11,905 |
| Bacon, microwaved, 2 slices, 3 min | 9,023 | 13 | 1,173 |
| Sausage, beef/pork links, pan-fried | 5,426 | 90 | 4,883 |
| SEAFOOD | AGEs per 100g | Serving Size | AGEs per serving |
| Salmon, filet, broiled | 3,347 | 90 | 3,012 |
| Salmon, filet, poached | 2,292 | 90 | 2,063 |
| Shrimp, marinated, raw | 1,003 | 90 | 903 |
| Shrimp, marinated, grilled on BBQ | 2,089 | 90 | 1,880 |
| Trout, baked, 25 min | 2,138 | 90 | 1,924 |
| CHEESE | AGEs per 100g | Serving Size | AGEs per serving |
| American, white, processed | 8,677 | 30 | 2,603 |
| Feta, Greek, soft | 8,423 | 30 | 2,527 |
| Parmesan, grated (Kraft) | 16,900 | 15 | 2,535 |
| Swiss, processed | 4,470 | 30 | 1,341 |
| SOY | AGEs per 100g | Serving Size | AGEs per serving |
| Burger (Boka burger) microwaved, 1.5 min | 67 | 30 | 20 |
| Burger (Boka burger) skillet, spray, 5 min | 100 | 30 | 30 |
| Tofu, broiled | 4,107 | 90 | 3,696 |
| Tofu, sauteed | 5,877 | 90 | 5,289 |
| EGGS | AGEs per 100g | Serving Size | AGEs per serving |
| Fried, one large | 2,749 | 45 | 1,237 |
| Scrambled, one large, pan, high, w/cooking spray, 1 min | 117 | 30 | 35 |
| Scrambled, pan, high, w/margarine, 1 min | 123 | 30 | 37 |
| Scrambled, pan, medium-low, w/butter, 2 min | 167 | 30 | 50 |
| BREADS | AGEs per 100g | Serving Size | AGEs per serving |
| Bagel, toasted | 167 | 30 | 50 |
| Biscuit (McDonald’s) | 1,470 | 30 | 441 |
| 100% whole wheat | 53 | 30 | 16 |
| White, Italian | 23 | 30 | 7 |
| Croissant, w/butter, (Starbucks) | 1,113 | 30 | 334 |
| Dinner roll | 77 | 30 | 23 |
| BREAKFAST CEREALS | AGEs per 100g | Serving Size | AGEs per serving |
| Cinnamon Toast Crunch (General Mills) | 1,100 | 30 | 330 |
| Corn Flakes (Kellogg’s) | 233 | 30 | 70 |
| Corn Flakes, Honey Nut (Kellogg’s) | 320 | 30 | 96 |
| Corn Flakes, Sugar Frosted (Kellogg’s) | 427 | 30 | 128 |
| Cream of Wheat, instant/prepared (Nabisco) | 108 | 175 | 189 |
| Fiber One (General Mills) | 1,403 | 30 | 421 |
| Rice Krispies (Kellogg’s) | 2,000 | 30 | 600 |
| Oatmeal, instant, dry (Quaker Oats) | 13 | 30 | 4 |
| BREAKFAST FOODS | AGEs per 100g | Serving Size | AGEs per serving |
| French toast, frozen, microwaved (Aunt Jemima) | 603 | 30 | 181 |
| Hot cakes (McDonald’s) | 243 | 30 | 73 |
| Pancake from mix | 823 | 30 | 247 |
| Pancake, frozen, toasted (General Mills) | 2,263 | 30 | 679 |
| Waffle, frozen, toasted (Kellogg’s) | 2,870 | 30 | 861 |
| GRAINS & LEGUMES | AGEs per 100g | Serving Size | AGEs per serving |
| Beans, red kidney, raw | 116 | 100 | 116 |
| Pasta, cooked, 12 min | 242 | 100 | 242 |
| Pasta, spiral | 245 | 100 | 245 |
| Rice, white, quick-cooking, 10 min | 9 | 100 | 9 |
| STARCHY VEGETABLES | AGEs per 100g | Serving Size | AGEs per serving |
| Corn, canned | 20 | 100 | 20 |
| Potato, sweet, roasted, one hour | 72 | 100 | 72 |
| Potato, white, boiled, 25 min | 17 | 100 | 17 |
| Potato, white, roasted 45 min, 5ml oil per svg | 218 | 100 | 218 |
| Potato, white, french fries (McDonald’s) | 1,522 | 100 | 1,522 |
| SNACKS | AGEs per 100g | Serving Size | AGEs per serving |
| Corn chips (Dorito’s) | 503 | 30 | 151 |
| Potato chips, baked (FritoLay) | 450 | 30 | 135 |
| Nacho cheese pretzel Combos (M&M Mars) | 1,680 | 30 | 504 |
| Chocolate Teddy Grahams (Nabisco) | 1,647 | 30 | 494 |
| Goldfish crackers (Pepperidge Farms) | 2,177 | 30 | 653 |
| Air-popped popcorn w/butter | 133 | 30 | 40 |
| Microwave popcorn, fat free (PopSecret/General Mills) | 33 | 30 | 10 |
| COOKIES, CAKES, PASTRIES | AGEs per 100g | Serving Size | AGEs per serving |
| Granola bar, chocolate chunk, soft (Quaker) | 507 | 30 | 152 |
| Rice Krispies Treat (Kellogg’s) | 1,920 | 30 | 576 |
| Cookie, biscotti, vanilla almond (Starbuck’s) | 3,220 | 30 | 966 |
| Cookie, chocolate chip (Nabisco) | 1,683 | 30 | 505 |
| Cookie, Oreo (Nabisco) | 1,770 | 30 | 531 |
| Donut, glazed, devil’s food cake (Krispy Kreme) | 1,407 | 30 | 422 |
| Donut, chocolate-iced, cream-filled (Krispy Kreme) | 1,803 | 30 | 541 |
| Fruit rollup, “Sizzlin’ red” (General Mills) | 980 | 30 | 294 |
| Apple pie, individual, baked (McDonald’s) | 637 | 30 | 191 |
| Pop tart, microwave, 3 secs, high (Kellogg’s) | 243 | 30 | 73 |
| FRUITS | AGEs per 100g | Serving Size | AGEs per serving |
| Apple, baked | 45 | 100 | 45 |
| Banana | 9 | 100 | 9 |
| Cantaloupe | 20 | 100 | 20 |
| Fig, dried | 2,663 | 30 | 799 |
| Plums, dried, pitted prunes (Sun-Maid) | 167 | 30 | 50 |
| Raisin from Post Raisin Brain (Kellogg’s) | 120 | 30 | 36 |
| VEGETABLES | AGEs per 100g | Serving Size | AGEs per serving |
| Carrots, canned | 10 | 100 | 10 |
| Celery | 43 | 100 | 43 |
| Cucumber | 31 | 100 | 31 |
| Eggplant, grilled, marinated w balsamic vinegar | 256 | 100 | 256 |
| Eggplant, raw, marinated w balsamic vinegar | 116 | 100 | 116 |
| Green beans, canned | 18 | 100 | 18 |
| Portabella mushroom, raw, marinated w balsamic | 129 | 100 | 129 |
| Onion | 36 | 100 | 36 |
| Tomato | 23 | 100 | 23 |
| Tomato sauce (Del Monte Foods) | 11 | 100 | 11 |
| Grilled broccoli, carrots and celery | 226 | 100 | 226 |
| Grilled peppers and mushrooms | 261 | 100 | 261 |
| MILK and MILK PRODUCTS | AGEs per 100g | Serving Size (mL) | AGEs per serving |
| Swiss Miss hot cocoa packet, prepared | 262 | 250 | 656 |
| Swiss Miss hot cocoa packet, prepared, sugar-free | 204 | 250 | 511 |
| Milk, fat-free | 1 | 250 | 2 |
| Milk, whole, 4% fat | 5 | 250 | 12 |
| Pudding, instant, chocolate, skim milk | 1 | 120 | 1 |
| Yogurt, cherry (Dannon) | 4 | 250 | 10 |
| FRUIT JUICES | AGEs per 100g | Serving Size (mL) | AGEs per serving |
| Apple | 2 | 250 | 5 |
| Orange | 6 | 250 | 14 |
| Orange, from fresh fruit | 0 | 250 | 1 |
| Orange, with calcium | 3 | 250 | 8 |
| Fruit pop, frozen (Dole) | 18 | 60 | 11 |
| Honey | 7 | 15 | 1 |
| Sherbet, strawberry (Edy’s) | 2 | 125 | 3 |
| COMBINATION FOODS | AGEs per 100g | Serving Size | AGEs per serving |
| Bacon/egg/cheese biscuit (McDonald’s) | 2,289 | 100 | 2,289 |
| Big Mac (McDonald’s) | 7,801 | 100 | 7,801 |
| Cheeseburger (McDonald’s) | 3,402 | 100 | 3,402 |
| Chicken McGrill (McDonald’s) | 5,171 | 100 | 5,171 |
| Double quarter pounder w/cheese (McDonald’s) | 6,283 | 100 | 6,283 |
| Filet-o-fish (McDonald’s) | 6,027 | 100 | 6,027 |
| Hummus w/garlic and scallions | 884 | 100 | 884 |
| Hummus w/vegetables | 487 | 100 | 487 |
| Veggie burger, 400 degrees F (Amy’s Kitchen) | 198 | 100 | 198 |
| CHOCOLATE | AGEs per 100g | Serving Size | AGEs per serving |
| Hershey’s Special Dark Chocolate (Hershey Co.) | 1,777 | 30 | 533 |
| M&Ms, milk chocolate (Mars) | 1,500 | 30 | 450 |
| Reese’s Peanut Butter Cup (Hershey Co.) | 3,440 | 30 | 1,032 |
| Snickers (Nestle) | 263 | 30 | 79 |
| CONDIMENTS | AGEs per 100g | Serving Size | AGEs per serving |
| Pickle, bread and butter | 10 | 30 | 3 |
| Ketchup | 13.33 | 15 | 2 |
| Mustard | 0 | 15 | 0 |
| Soy sauce | 60 | 15 | 9 |
| BEVERAGES | AGEs per 100g | Serving Size (mL) | AGEs per serving |
| Budweiser beer, (Anheuser Busch) | 1.2 | 250 | 3 |
| Breast milk, fresh | 6.67 | 30 | 2 |
| Breast milk, frozen | 10 | 30 | 3 |
| Coca-Cola Classic | 2.8 | 250 | 7 |
| Coffee w/milk and sugar | 2.4 | 250 | 6 |
| Coffee, drip method | 1.6 | 250 | 4 |
| Pepsi, diet (PepsiCo) | 2.8 | 250 | 7 |
| Pepsi, diet, caffeine-free (PepsiCo) | 2.4 | 250 | 6 |
| Pepsi, regular (PepsiCo) | 2.4 | 250 | 6 |
| Rum, Baccardi Superior (80 proof) | 0 | 250 | 0 |
| Sprite (Coca-Cola Co.) | 1.6 | 250 | 4 |
| Tea, teabag (Lipton) | 2 | 250 | 5 |
| Vodka, Smirnoff (80 proof) | 0 | 250 | 0 |
| Whiskey, Dewars, white label | .4 | 250 | 1 |
| Wine, Pinot Grigio | 32.8 | 250 | 82 |
| Wine, Pinot Noir | 11.2 | 250 | 28 |
References
- Clarke, R.E., et al. “Dietary advanced glycation end products and risk factors for chronic disease: A systematic review of randomised controlled trials.” Nutrients, 2016; 8(3):125.
- DeChristopher, L.R., et al. “Perspective: The paradox in dietary advanced glycation end products research — The source of the serum and urinary advanced glycation end Products is the intestines, not the food.” Advances in Nutrition, 2017 Sept. 15; 8(5):679.
- Di Pino, A., et al. “High intake of dietary advanced glycation end products is associated with increased arterial stiffness and inflammation in subjects with type 2 diabetes.” Nutrition, Metabolism, and Cardiovasc Diseases. 2017; Epub; Jul 8.
- Uribarri, J., et al. “Dietary advanced glycation end products and their role in health and disease.” Advances in Nutrition. 2015; 15:6(4):461.
- Uribarri, J., et al. “Advanced glycation end products in foods and a practical guide to their reduction in the diet.” Journal of the American Dietetic Association. 2010; 110(6):911–16.e12.
- Vlassara, H. “Identifying advanced glycation end products as a major source of oxidants in aging: Implications for the management and/or prevention of reduced renal function in elderly persons.” Seminars in Nephrology .2009;29(6):594-603.
- www.nutritionfacts.org/video/glycotoxins/
- Yacoub, R., et al. “Advanced glycation end products dietary restriction effects on bacterial gut microbiota in peritoneal dialysis patients: A randomized open-label controlled trial.” PLoS One. 2017; 12(9):e0184789.
- Yang X. et al. CD36 in chronic kidney disease: novel insights and therapeutic opportunities. Nat Rev Nephrol.2017 Sep 18. doi: 10.1038/nrneph. 2017.126. [Epub ahead of print].
Editor’s Note: This article was edited after publication to clarify the contents of the chart about the ways AGEs present in foods. In addition, the term for ‘water intoxication’ has been corrected.

Larry Gagnon - 1976 1968
Is there any data on how many AGEs on a daily or yearly or life-time basis cause any specific disease or show a statistic correlation with any specific disease?
The more that I read about food, the more that I think the best alternative is to stop eating. It seems that every food is named in some article as potentially toxic.
I am not sure that attempting to minimize ingestion of all such potentially toxic foods will result in living 100 years, but I am rather sure that any such attempt will make life feel that long.
Reply
Abigail Welborn - 2004
Haha I’m kind-of with you. Sugar is highly inflammatory, but even sodas are low in AGEs.
To be fair, my reaction is, “What are we supposed to do, just eat vegetables and rice?” and maybe a lot of dieticians would say, “Yes!” To which I have your reaction… what’s the point of living 100 years if you have to eat nothing but vegetables! 😉
Reply
Kara Lynn - 1989
Thank you for this eye-opening article. Could you please explain or direct me to further information about eggs. The huge difference in AGEs between fried and scrambled eggs is difficult to make sense of. It would also be interesting to know about microwaved scrambled eggs – my preferred method of cooking. What about hard-boiled, a regular lunch-box item for many children. Thank you.
Reply
Deborah Holdship
See this link, which was the source for a more comprehensive chart of foods, including eggs: https://www.ncbi.nlm.nih.gov/pmc/articles/PMC3704564/table/T1/
Reply
Ruth Blackburn - 1993
Please note that the correct association that published the article with the table is The American Dietetic Association now called The Academy of Nutrition and Dietetics. Thank you.
Reply